
Related Blogs
October 12, 2018 | Michael Reilly
Stock market drops like what we experienced this week can be really scary, even for seasoned investors.
Nobody likes to see the value of their portfolio go down.
These kind of market sell-offs often cause panic, resulting in emotional selling in hopes of protecting against further loss… Yet, that’s usually not the right move.
Instead, take a deep breath and put the market’s decline into perspective.
First, try separating the hype from reality…
That’s asking a lot when financial news outlets are adept at sending out eye catching, heart-thumping headlines like the ones below:
Dow drops 832-points making it among the worst in the market benchmark’s history.
-or-
The S&P 500 sees a nearly unprecedented drop, falling 95 points, making it the fourth-worst ever.
Who wouldn’t panic after reading headlines like those. Yikes!
But here’s the problem – take Wednesday’s 832-point decline for example, it’s hugely misleading.
That’s because over the last decade market indices have climbed – a lot. Meaning, what were once considered exceptional point moves aren’t nearly as meaningful today.
Take October 19, 1987 (A.K.A. Black Monday) for example, the Dow plunged 508-points. That was truly cataclysmic, as the DOW was only around 2,200 points at the time.
That means the 508-point drop represented a nearly 23% decline of the DOW in a single day. Ouch.
So, even though Wednesday’s drop was much larger in terms of points, 832 vs. 508, the fact that the Dow is now above 25,000 means that Wednesday’s point drop translates into just about a 3% decline.
Corrections, defined as a decline of 10% or more, are normal occurrences in equity markets. So investors must be willing to accept that markets don’t always go up. It can be a bumpy road sometimes.
Believe it or not, when markets are in a free fall, as they are this week, most people won’t remember the pain that the drop caused.
You don’t have to go back that far to see an example of this. In February, the Dow suffered not one but two declines of more than 1,000 points in short succession.
Those drops were part of a broader market correction that eventually sent market indices down roughly 12% in less than a month.
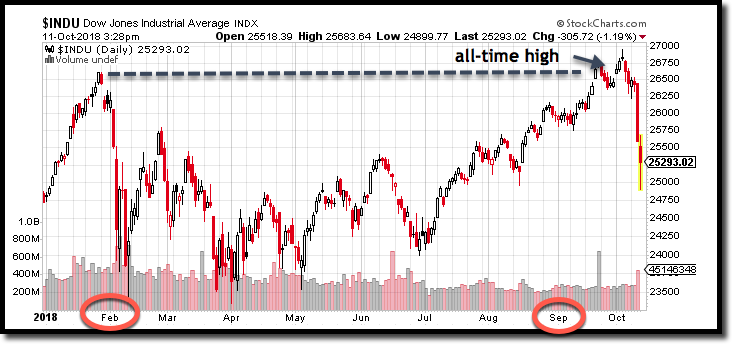
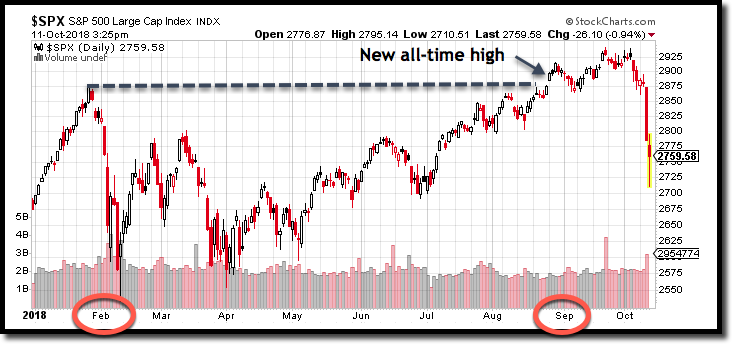
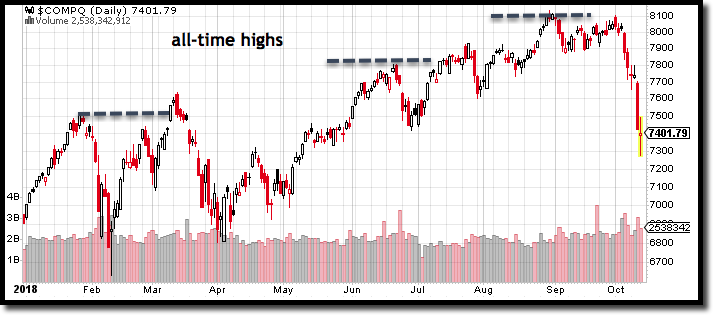
Yet, as can be seen in the index charts above, it was just a matter of months before the Dow, S&P 500, and NASDAQ all recovered earlier losses and reached new all-time highs.
In hindsight, what seemed like scary gargantuan plunges were only a brief pause in the continuation of a bull market.
Investors need to do their best to stick to their investment rules, consider the big picture, and avoid the hype and noise that often accompanies market volatility.
So, this leads to the next big question on everyone’s mind-
Is this the end of the bull run or just another pause before the next move higher?
Investors are always looking for the magic bullet. That thing that they can consistently rely on that says “do this, right now.”
Well, there is no magic bullet.
So here’s the closest thing we have, it’s the NYSE Bullish Percent Index, or BPI.
And it’s one of the first places we’ll look to for a general idea of the overall health and direction of the equity markets.
It’s a breadth indicator, measuring market participation of all the stocks listed on the New York Stock Exchange, and it’s the granddaddy of all risk barometers.
Here’s what it’s telling us now…
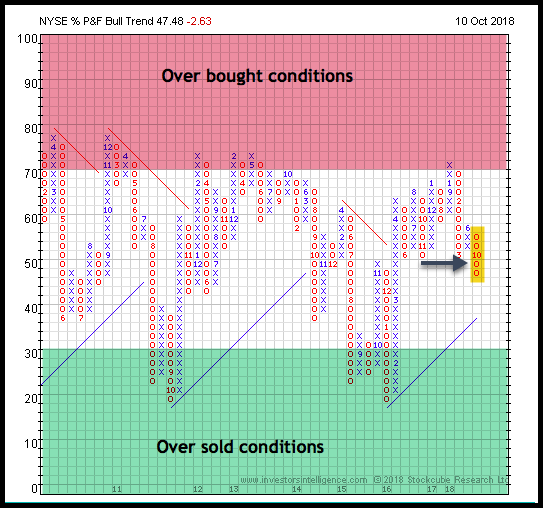
See the highlighted column to the far right – that’s the BPI flipping to a column of O’s last Friday – the arrow marks a spot of additional selling, causing our indicator to give a sell signal.
A column of O’s occurs when more stocks are falling in price on the NYSE than are rising. The sell signal is confirmation that the market is under pressure.
A positive take away here, is that the market is neither overbought – meaning higher risk to the downside, or oversold – meaning a washed out market, but sits in “good field position.”
This is not a signal investors should panic and move to 100% cash. It is however, a sign to investors to look closely at their current holdings and proceed with caution. Investors should have a plan for a market that either continues to slide or reverses course back to the upside.
In addition to the NYSE BPI, we also look at shorter term indicators that view the market over a 10 week or 30 week time frame.
Below is the NYSE %30 chart. It’s similar to the chart above, but this indicator views the market over a 150 day period – making it a short term indicator. Changes to the NYSE BPI will be seen here first.
The past week’s selling and drop of stock prices have caused this key indicator to flip to a column of O’s, telling investors that selling is in control of the market.
We’ll be looking for a reversal in this indicator from O’s to X’s, advising us that demand has once again taken control of the market.
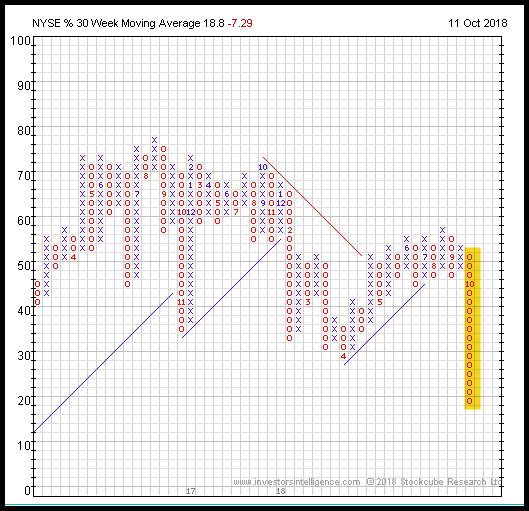
When the %30wk reverses back to X’s, it will be time for investors to review their shopping list of securities, to see what may be on sale.
But until that happens, be cautious with new purchases.
Correlation of asset classes and market performance:
Historically, when U.S. equities are strong, meaning ranked as the #1 or #2 asset class, markets have remained stable and on average, have provided positive returns. Not shoot the lights out kind of performance, but positive returns nonetheless.
But, when U.S. equities are considered weak – meaning ranked #3 or below, markets on average have had negative returns.
And here’s the good news, U.S. equities are the #1 ranked asset class, a place they held since August of 2016.
U.S. equities are still the place to be long term. But there can still be times when volatility enters the market causing fear and frustration.
Perhaps, investors can take some comfort in knowing that October has a bit of a reputation.
Yes, October is sometimes known as the “jinx month” because several infamous market crashes including Black Tuesday (1929) and Black Monday (1987) occurred during October.
However, according to the 2018 Stock Trader’s Almanac, October is also known as a “bear killer.” Having “turned the tide in 12 post-WWII bear markets.”
Let’s add a little perspective about what ultimately drives markets up or down.
Headlines influence markets in the short-term. Economic data is the driver behind long term bull and bear markets.
Investors should ask themselves – How’s the economy? Well…
The U.S. economy is strong and healthy.
Employment numbers are off the charts.
…and corporate earnings continue to rise.
Stock markets don’t move from bull to bear when those elements are in play.
Markets move into long term bear status when economic data suggests we’re entering a recession.
And recessions don’t happen in growing economies.
What’s really happening here is that markets today are reacting to several headline concerns.
The Federal Reserve is tightening monetary policy by raising rates – much to the chagrin of President Trump. The fear is that rates will rise too quickly and stall the economy. But…rates have a long way to go before that should be a concern.
Why are rates rising? Because we have a strong economy, and the Fed doesn’t want it to overheat.
There’s also worry over the trade war with China – the concern is that it could turn into a protracted tug of war between two of the world’s largest economies, and ultimately have a negative impact on the United States.
However, neither country wants this to go on too long, as it doesn’t benefit either nation. When a deal is reached, markets will react positively.
Plus…just recently, there was an announcement out of Washington that President Trump and the President of China – Xi Jinping, are scheduled to meet during an upcoming G20 conference.
The point is, while you could consider this a time to be cautious (as always), a 5% drop isn’t really a cause to panic in the midst of a growing economy.
If you have any more questions about what technical analysis is showing us in the current market, feel free to schedule a call with one of our advisors.
You might also be interested in learning about how relative strength data allows us to find sectors that remain strong, even in times of (slight) upheaval like this, and which could provide good opportunities for growth when the market bounces back.
Click here now to make an appointment.
As always, invest wisely.

Get Our FREE Guide
How to Find the Best Advisor for You
Learn how to choose an advisor that has your best interests in mind. You'll also be subscribed to ADAPT, Avalon’s free newsletter with updates on our strongest performing investment models and market insights from a responsible money management perspective.
