
Related Blogs
April 23, 2018 | Michael Reilly

At the end of January 2018, Commodities wrestled their way into third place in the Asset Class rankings, behind U.S. and International Equities.
The move displaced Fixed Income from its grip on the third spot, slipping into fourth position in our Global Asset Map ranking system.
(See Global Relative Strength Conditions for the latest relative strength and performance comparisons of the six Asset Classes and the sectors within them.)
It’s worth noting that the top three Asset Classes are all considered offensive or “risk on”, emphasizing wealth accumulation.
While Fixed Income and Cash (ranked #4 and #5 respectively) are considered defensive or “risk off” Asset Classes, placing greater emphasis on the preservation of wealth.
Current Asset Class rankings indicate that “smart money” — big institutions and hedge funds — are still pumping money into growth assets, despite the recent market volatility.
Oil drives the charge
As an Asset Class, Commodities can be broken down into four major sectors: Energy, Industrial Metals, Precious Metals and Agriculture.
Within the Energy sector, crude oil (a sub-sector of Energy), has been the primary driver behind Commodities’ charge upwards.
As momentum accelerated in the Energy sector, so to did its ranking within Commodities, rising from the weakest sector to the strongest. The impressive rise to the top took place during a single quarter — the fourth quarter of 2017.
Energy’s rise to the top of the Commodity matrix may be attributable to geopolitical concerns, the falling dollar, or both. We don’t know.
As technical money managers, we focus more on the “what,” than the “why.”
And what we know is this: prices of crude oil continue to rise.
It’s a trend that continued throughout Q1 2018 and remains intact entering Q2.
And remember, “the trend is your friend”. So Crude Oil’s current strength within the Energy space is something investors should pay attention to.
The Crude Oil Continuous (CL/) Point-and-Figure chart below shows a steady improvement since September of 2017:
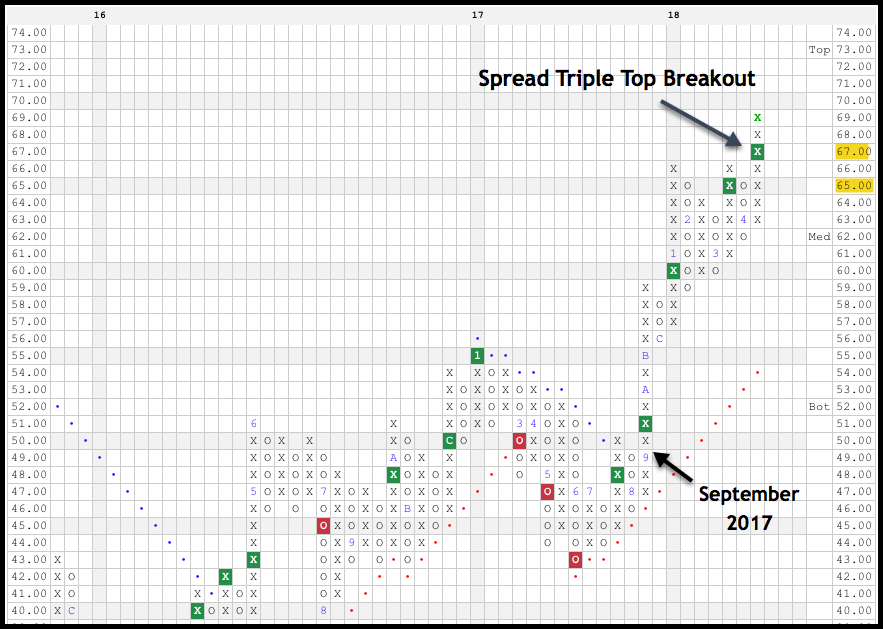
After completing a bullish triangle pattern in March at $65, crude broke a spread triple top at $67, in April of this year and is currently trading at multi-year highs.
Market technicians view spread triple tops and bullish triangle patterns as positive indicators.
Commodity vs. Stock
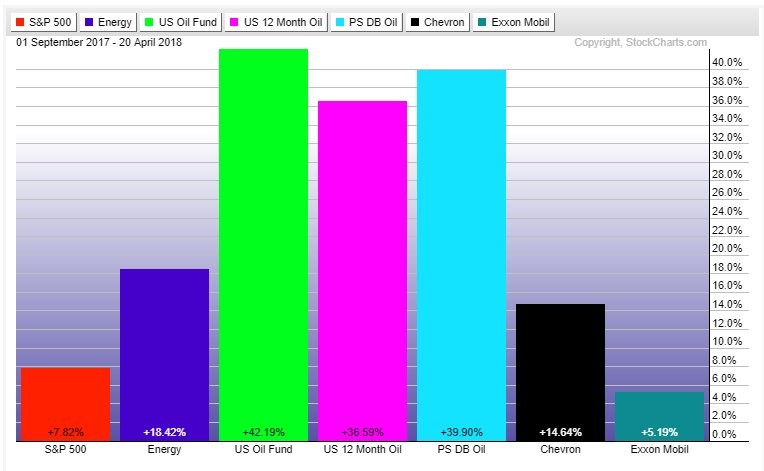
The first two bar charts below (available at StockCharts.com) compares the performance of the following:
- The S&P 500, representing the broader market
- The SPDR Energy Select ETF (XLE), an ETF which holds Energy-related stocks
- USO,USL,and DBO: three oil ETFs, which invest in Energy-related commodities
- Chevron (CVX) AND ExxonMobil (XOM), two oil-related stocks
The first chart compares performance beginning 4th quarter 2017 (September 1, 2017) thru April 20, 2018.
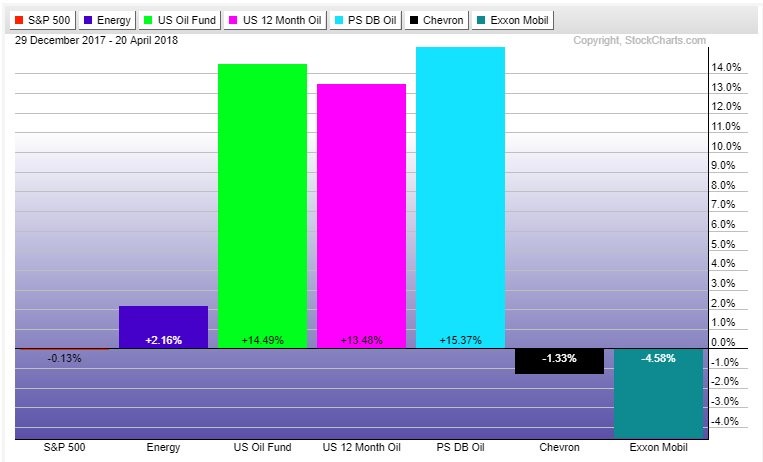
The second chart illustrates the same positions, but provides year-to-date performance (2018).
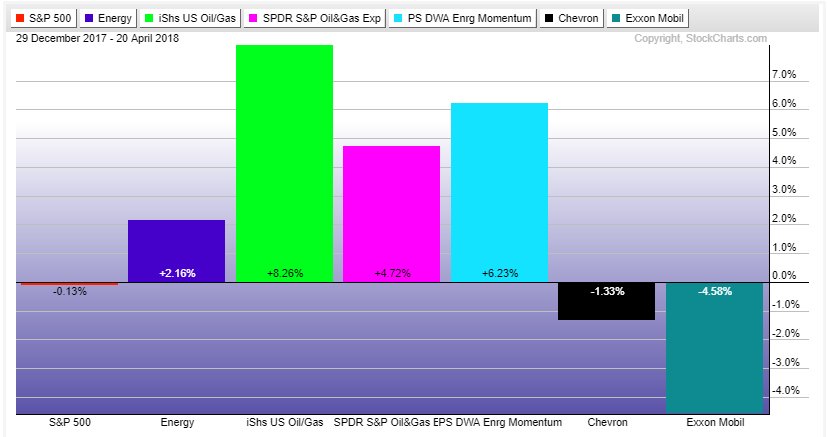
For additional comparison I’ve included a third bar chart (below) comparing the performance of the S&P 500 with several Oil stock ETFs
- The SPDR Energy Select ETF (XLE)
- The iShares S&P Oil & Gas Exploration ETF (IEO)
- The SPDR S&P Oil & Gas Exploration ETF (XOP)
- The PowerShares DWA Energy Momentum ETF (PXI)
- Chevron (CVX) and ExxonMobil (XOM)
The three charts above tell a compelling story.
Energy sector ETFs in the Commodities Asset Class have a substantial edge over Energy sector stocks and stock ETFs in the Domestic Equities Asset Class.
This is due in part to what’s known as “contango,” a situation where the futures price of oil is higher than the current spot price — but again, we’re interested in the “what,” not the “why.”
Bottom line: The dispersion between stock and commodity ownership this year in the Energy space could have netted investors an additional 5%-20% profits.
So, while investors who knew where to look profited nicely from investing in Commodity related oil funds, investors who invested only in oil related stocks or stock ETFs did not see the same degree of profits, or are actually staring at losses on a year to date basis.
Although Energy stock ETFs like EIO and XOP — two ETFs focused on investment in Oil & Gas Exploration & Production — and PXI, a PowerShares Momentum ETF, have all improved recently, particularly over the last month, they are now up against historical price resistance, making them look suspect.
Long term price resistance has been highlighted on the charts below. This resistance is an area where, in the past, sellers have come in and knocked the price back down
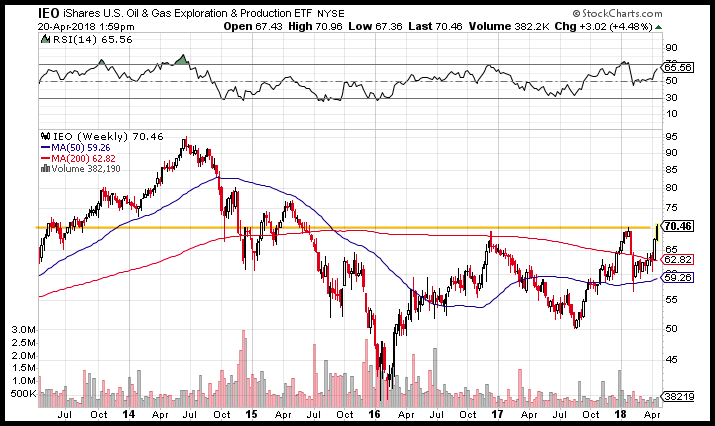
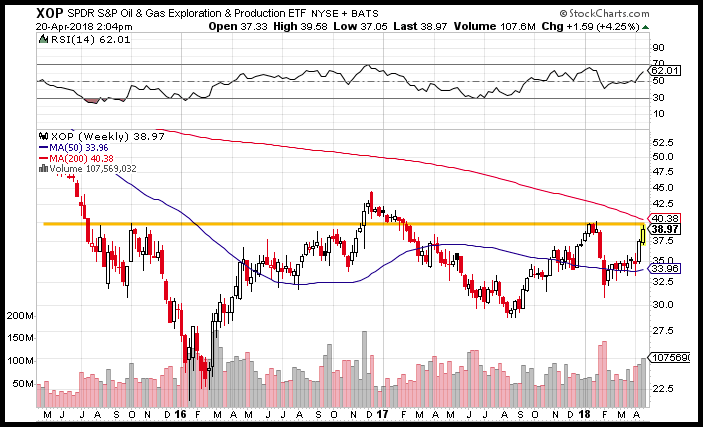
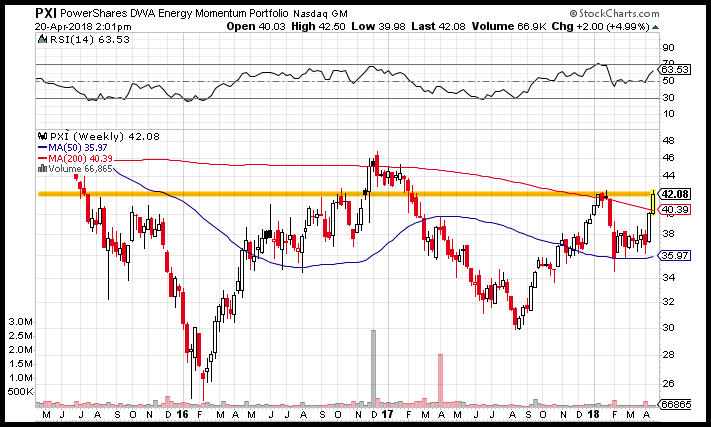
So, until these stock ETFs can show a sustainable move above resistance, investors looking for exposure to the Energy space and Crude Oil may want to consider alternatives in Commodities.
As always, remember your rules regarding proper risk management and position sizing.
To measure how well your current positions match your personal risk tolerance, talk to the experts at Rowe Wealth Management. Schedule a consultation by pressing the button below.
Tags

Get Our FREE Guide
How to Find the Best Advisor for You
Learn how to choose an advisor that has your best interests in mind. You'll also be subscribed to ADAPT, Avalon’s free newsletter with updates on our strongest performing investment models and market insights from a responsible money management perspective.
